Looker by Google and Microsoft Power BI are both business intelligence (BI) and data analytics platforms that maintain a strong following. These platforms have grown their customer bases by staying current with the data analytics space, and by enabling digital transformation, data mining, and big data management tasks that are essential for modern enterprises. In particular, both of these vendors have begun investing in tools and resources that support data democratization and AI-driven insights.
As two well-regarded data analytics platforms in the BI space, users may have a difficult time deciding between Looker and Power BI for their data management requirements. There are arguments for and against each, and in this comparison guide, we’ll dive deeper into core features, pros, cons, and pricing for Looker and Power BI.
But before we go any further, here’s a quick summary of how each product stands out against its competitors:
- Looker: Best for current Google product users and others who are most interested in highly configurable and advanced analytics capabilities, including data visualizations and reporting. Looker Studio in particular balances ease of use with high levels of customization and creativity, while also offering users a lower-cost version of an otherwise expensive platform.
- Power BI: Best for current Microsoft product users and others who want an easy-to-use and affordable BI tool that works across a variety of data types and use cases. This is considered one of the most popular BI tools on the market and meets the needs of a variety of teams, budgets, and experience levels, though certain customizations and big data processing capabilities are limited.
TABLE OF CONTENTS
Looker vs. Power BI at a Glance
| Core Features | Ease of Use and Implementation | Advanced Data Analytics | Integrations | Pricing | |
|---|---|---|---|---|---|
| Looker | Dependent on Use Case | ✘ | Dependent on Use Case | ||
| Power BI | Dependent on Use Case | ✘ | Dependent on Use Case | ✘ |
What Is Looker?

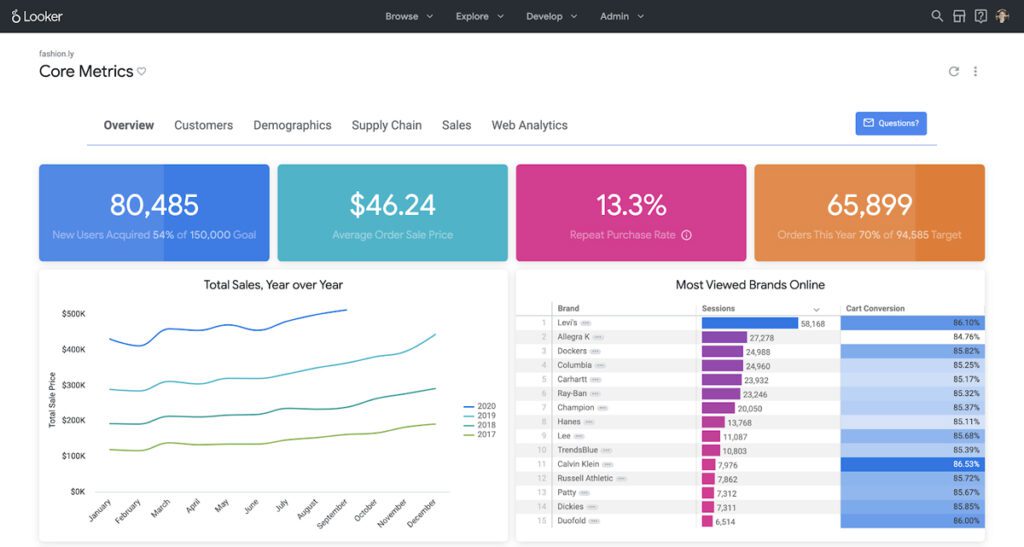
Looker is an advanced business intelligence and data management platform that can be used to analyze and build data-driven applications, embed data analytics in key organizational tools, and democratize data analysis in a way that preserves self-service capabilities and configurability. The platform has been managed by Google since its acquisition in 2019, and because of its deep integration within the Google ecosystem, it is a favorite among Google Cloud and Workspace users for unified analytics projects. However, the tool also works well with other cloud environments and third-party applications, as it maintains a fairly intuitive and robust collection of integrations.
Key features of Looker

- Comprehensive data visualization library: In addition to giving users the ability to custom-configure their visualizations to virtually any parameters and scenarios, Looker’s data visualization library includes a wide range of prebuilt visual options. Traditional visuals like bar graphs and pie charts are easy to access, and more complex visuals — like heatmaps, funnels, and timelines — can also be easily accessed.
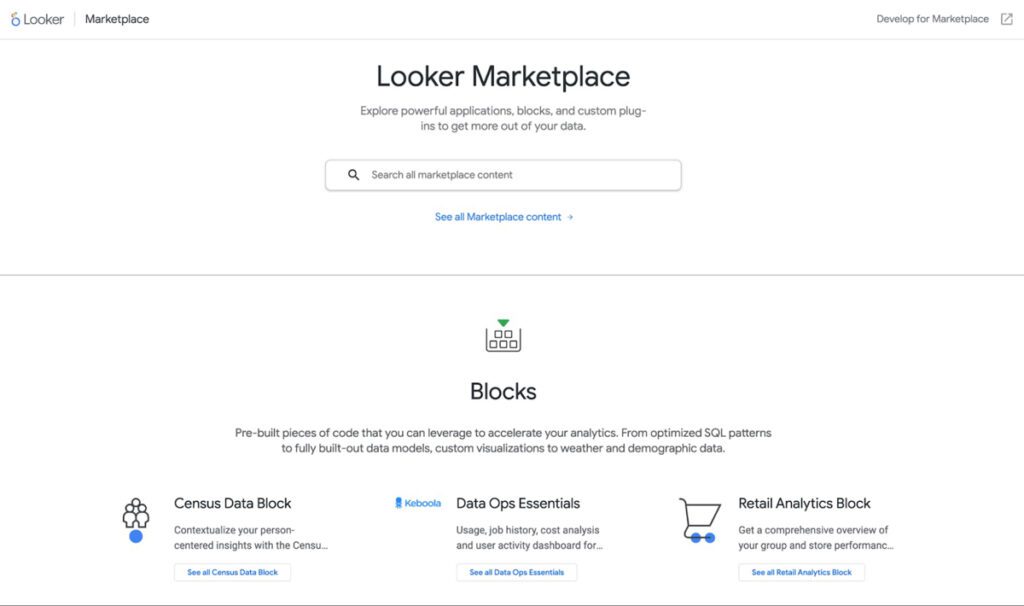
- “Blocks” code snippets: Instead of reinventing the wheel for certain code snippets and built-out data models, Looker Blocks offers prebuilt data models and code to help users quickly develop high-quality data models. Industry-specific, cloud-specific, and data-source-specific blocks are all available, which makes this a great solution for users of all backgrounds who want to get started with complex models more quickly.
- Governed and integrated data modeling: With its proprietary modeling language and emphasis on Git-driven data storage and rule development, users can easily build trusted and governed data sources that make for higher-quality and more accurate data models, regardless of how many teams are working off of these models.
Pros
- Looker comes with a large library of prebuilt integrations — including for many popular data tools — and also offers user-friendly APIs for any additional integrations your organization may need to set up.
- Looker’s visualizations and reports are easy to customize to your organization’s more specific project requirements and use cases; it also offers one of the more diverse visualization libraries in this market.
- LookML allows users to create centralized governance rules and handle version control tasks, ensuring more accurate outcomes and higher quality data, even as data quantities scale.
Cons
- On-premises Looker applications do not easily connect to Looker Studio and other cloud-based tools in user portfolios, which severely limits the ability to maintain data projects accurately and in real time for on-prem users.
- Looker uses its own modeling language, which can make it difficult for new users to get up and running quickly.
- Some users have had trouble with self-service research and the vendor’s documentation.
What Is Power BI?

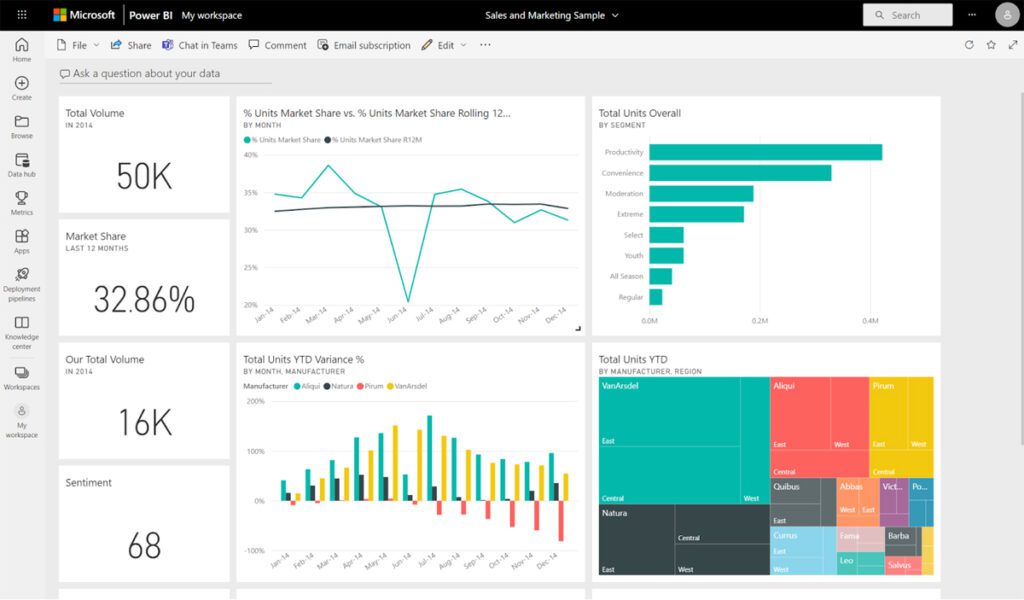
Microsoft Power BI is a business intelligence and data visualization solution that is one of the most popular data analytics tools on the market today. As part of the Microsoft Power Platform, the tool is frequently partnered with Microsoft products like Power Automate, Power Apps, and Power Pages to get the most out of data in different formats and from different sources. Its focus on ease of use makes it a leading option for teams of all backgrounds; especially with the growth of its AI-powered assistive features, visualization templates, and smooth integrations with other Microsoft products, it has become one of the best solutions for democratized data science and analytics.
Key features of Power BI

- AI-driven analytics: AI-powered data analysis and report creation have already been established in this platform, but recently, the generative AI Copilot tool has also come into preview for Power BI. This expands the platform’s ability to create reports more quickly, summarize and explain data in real time, and generate DAX calculations.
- Dynamics 365 integration: Power BI integrates relatively well with the Microsoft Dynamics CRM, which makes it a great option for in-depth marketing and sales analytics tasks. Many similar data platforms do not offer such smooth CRM integration capabilities.
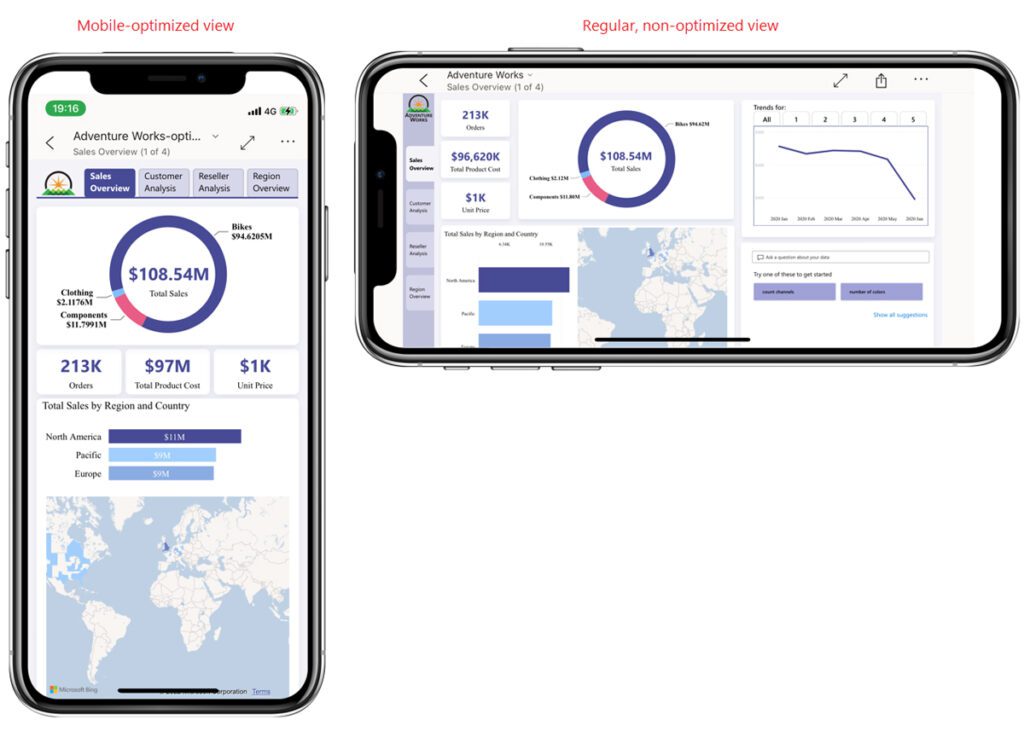
- Comprehensive mobile version: Unlike many other competitors in this space, Microsoft Power BI comes with a full-featured, designed-for-mobile mobile application that is available at all price points and user experience levels. With native mobile apps available for Windows, iOS, and Android, any smartphone user can quickly review Power BI visualizations and dashboards from their personal devices.
Pros
- Power BI can be used in the cloud, on-premises, and even as an embedded solution in other applications.
- The user interface will be very familiar to users who are experienced with Microsoft products; for others, the platform is accompanied by helpful training resources and ample customer support.
- This platform makes democratized data analytics simpler, particularly with AI-powered features and a growing generative AI feature set.
Cons
- While some users appreciate that Power BI resembles other Microsoft 365 office suite interfaces, other users have commented on the outdated interface and how it could be improved to look more like other cloud-based competitors.
- Especially with larger quantities of data, the platform occasionally struggles to process data quickly and accurately; slower load times, crashes, and bugs are occasionally introduced during this process.
- Visualizations are not very customizable, especially compared to similar competitors.
Best for Core Features: It Depends
Both Looker and Power BI offer all of the core features you would expect from a data platform, including data visualizations, reporting and dashboarding tools, collaboration capabilities, and integrations. They also offer additional features to assist users with their analytical needs. Power BI offers support through AI assistance and Looker supports users with prebuilt code snippets and a diverse integration and plugin marketplace.
Microsoft maintains a strong user base with its full suite of data management features and easy-to-setup integrations with other Microsoft tools. It can be deployed on the cloud, on-premises, and in an embedded format, and users can also access the tool via a comprehensive mobile application.
Looker is web-based and offers plenty of analytics capabilities that businesses can use to explore, discover, visualize, and share analyses and insights. Enterprises can use it for a wide variety of complex data mining techniques. It takes advantage of a specific modeling language to define data relationships while bypassing SQL. Looker is also tightly integrated with a great number of Google datasets and tools, including Google Analytics, as well as with several third-party data and business tools.
Looker earns good marks for reporting granularity, scheduling, and extensive integration options that create an open and governable ecosystem. Power BI tends to perform better than Looker in terms of breadth of service due to its ecosystem of Microsoft Power Platform tools; users also tend to prefer Power BI for a comprehensive suite of data tools that aren’t too difficult to learn how to use.
Because each tool represents such a different set of strengths, it’s a tie for this category.
Best for Ease of Use and Implementation: Power BI
In general, users who have tried out both tools find that Power BI is easier to use and set up than Looker.
Power BI provides users with a low-code/no-code interface as well as a drag-and-drop approach to its dashboards and reports. Additionally, its built-in AI assistance — which continues to expand with the rise of Copilot in Power BI — helps users initiate complex data analytics tasks regardless of their experience with this type of technology or analysis.
For some users, Looker has a steep learning curve because they must learn and use the LookML proprietary programming language to set up and manage their models in the system. This can be difficult for users with little experience with modeling languages, but many users note that the language is easy to use once they’ve learned its basics. They add that it streamlines the distribution of insights to staff across many business units, which makes it a particularly advantageous approach to data modeling if you’re willing to overcome the initial learning curve.
The conclusion: Power BI wins on general use cases for a non-technical audience whereas Looker wins with technical users who know its language.
Best for Advanced Data Analytics: Looker
While both tools offer unique differentiators for data analytics operations, Looker outperforms Power BI with more advanced, enterprise-level data governance, modeling, and analytics solutions that are well integrated with common data sources and tools.
Both tools offer extensive visualization options, but Looker’s data visualizations and reporting are more customizable and easier to configure to your organization’s specs and stakeholders’ expectations. Looker also streamlines integrations with third-party data tools like Slack, Segment, Redshift, Tableau, ThoughtSpot, and Snowflake, while also working well with Google data sources like Google Analytics. As far as its more advanced data analytics capabilities go, Looker surpasses Power BI and many other competitors with features like granular version control capabilities for reports, comprehensive sentiment analysis and text mining, and open and governed data modeling strategies.
However, Looker has limited support for certain types of analytics tasks, like cluster analysis, whereas Power BI is considered a top tool in this area. And, so far, Power BI does AI-supported analytics better, though Google does not appear to be too far behind on this front.
It’s a pretty close call, but because of its range of data analytics operations and the number of ways in which Google makes data analytics tasks customizable for its users, Looker wins in this category.
Also see: Best Data Analytics Tools
Best for Integrations: It Depends
When it comes to integrations, either Power BI or Looker could claim the upper hand here.
It all depends on if you’re operating in a Microsoft shop or a Google shop. Current Microsoft users will likely prefer Power BI because of how well it integrates with Azure, Dynamics 365, Microsoft 365, and other Microsoft products. Similarly, users of Google Cloud Platform, Google Workspace, and other Google products are more likely to enjoy the integrated experience that Looker provides with these tools.
If your organization is not currently working with apps from either of these vendor ecosystems, it may be difficult to set up certain third-party integrations with Power BI or Looker. For example, connecting Power BI to a collaboration and communication tool like Slack generally requires users to use Microsoft Power Automate or an additional third-party integration tool. Looker’s native third-party integrations are also somewhat limited, though the platform does offer easy-to-setup integrations and actions for tools like Slack and Segment.
Because the quality of each tool’s integrations depends heavily on the other tools you’re already using, Power BI and Looker tie in this category.
Best for Pricing: Power BI
Power BI is consistently one of the most affordable BI solutions on the market. And while Looker Studio in particular helps to lower Looker’s costs, the platform is generally considered more expensive.
Power BI can be accessed through two main free versions: Power BI Desktop and a free account in Microsoft Fabric. The mobile app is also free and easy to access. But even for teams that require more functionality for their users, paid plans are not all that expensive. Power BI Pro costs only $10 per user per month, while Power BI Premium is $20 per user per month.
Looker, on the other hand, is more expensive, requiring users to pay a higher price for its enterprise-class features. The Standard edition’s pay-as-you-go plan costs $5,000 per month, while all other plans require an annual commitment and a conversation with sales to determine how much higher the costs will be.
Additionally, there are user licensing fees that start at $30 per month for a Viewer User; users are only able to make considerable changes in the platform as either a Standard User or a Developer User, which costs $60 and $125 per user per month respectively.
Power BI takes the lead when it comes to pricing and general affordability across its pricing packages.
Also see: Top Digital Transformation Companies
Why Shouldn’t You Use Looker or Power BI?
While Looker and Power BI are both favorites among data teams and citizen data scientists alike, each platform has unique strengths — and weaknesses — that may matter to your team. If any of the following qualities align with your organizational makeup, you may want to consider investing in a different data platform.
Who Shouldn’t Use Looker
The following types of users and companies should consider alternatives to Looker:
- Users who want an on-premises BI tool; most Looker features, including useful connections to Looker Studio, are only available to cloud users.
- Users who are not already working with other Google tools and applications may struggle to integrate Looker with their most-used applications.
- Users with limited computer-language-learning experience may struggle, as most operations are handled in Looker Modeling Language (LookML).
- Users who want a lower-cost BI tool that still offers extensive capabilities to multiple users.
- Users in small business settings may not receive all of the vendor support and affordable features they need to run this tool successfully; it is primarily designed for midsize and larger enterprises.
Who Shouldn’t Use Power BI
The following types of users and companies should consider alternatives to Power BI:
- Users who need more unique and configurable visualizations to represent their organization’s unique data scenarios.
- Users who are not already working with other Microsoft tools and applications may struggle to integrate Power BI into their existing tool stack.
- Users who consistently process and work with massive quantities of data; some user reviews indicate that the system gets buggy and slow with higher data amounts.
- Users who work with a large number of third-party data and business apps; Power BI works best with other Microsoft tools, especially those in the Power Platform.
- Users who consistently need to run more complex analytics, such as predictive analytics, may need to supplement Power BI with other tools to get the results they need.
If Looker or Power BI Isn’t Ideal for You, Check Out These Alternatives
Both Looker and Power BI offer extensive data platform features and capabilities, as well as smooth integrations with many users’ most important data sources and business applications. However, these tools may not be ideally suited to your team’s particular budget, skill sets, or requirements. If that’s the case, consider investing in one of these alternative data platform solutions:
Domo
Domo puts data to work for everyone so they can extend their data’s impact on the business. Underpinned by a secure data foundation, the platform’s cloud-native data experience makes data visible and actionable with user-friendly dashboards and apps. Domo is highly praised for its ability to help companies optimize critical business processes at scale and quickly.
Yellowfin
Yellowfin is a leading embedded analytics platform that offers intuitive self-service BI options. It is particularly successful at accelerating data discovery. Additionally, the platform allows anyone, from an experienced data analyst to a non-technical business user, to create reports in a governed way.
Wyn Enterprise
Wyn Enterprise offers a scalable embedded business intelligence platform without hidden costs. It provides BI reporting, interactive dashboards, alerts and notifications, localization, multitenancy, and white-labeling in a variety of internal and commercial apps. Built for self-service BI, Wyn offers extensive visual data exploration capabilities, creating a data-driven mindset for the everyday user. Wyn’s scalable, server-based licensing model allows room for your business to grow without user fees or limits on data size.
Zoho Analytics
Zoho Analytics is a top BI and data analytics platform that works particularly well for users who want self-service capabilities for data visualizations, reporting, and dashboarding. The platform is designed to work with a wide range of data formats and sources, and most significantly, it is well integrated with a Zoho software suite that includes tools for sales and marketing, HR, security and IT management, project management, and finance.
Sigma
Sigma is a cloud-native analytics platform that delivers real-time insights, interactive dashboards, and reports, so you can make data-driven decisions on the fly. With Sigma’s intuitive interface, you don’t need to be a data expert to dive into your data, as no coding or SQL is required to use this tool. Sigma has also recently brought forth Sigma AI features for early access preview.
Review Methodology
Looker and Power BI were reviewed based on a few core standards and categories for which data platforms are expected to perform. The four categories covered below have been weighted according to how important they are to user retention over time.
User experience – 30%
When it comes to user experience, we paid attention to how easy each tool is to use and implement and how many built-in support resources are available for users who have trouble getting started. Additionally, we considered how well the platform performs under certain pressures, like larger data loads, security and user control requirements, and more complex modeling and visualization scenarios. Finally, we considered the availability of the tool in different formats and how well the tool integrates with core business and data applications.
Scalability and advanced analytics compatibility – 30%
Our review also considered how well each platform scales to meet the needs of more sophisticated analytics operations and larger data processing projects. We paid close attention to how the platform performs as data loads grow in size and complexity, looking at whether user reviews mention any issues with lag times, bugs, or system crashes. We also considered what tools were available to assist with more complex analytics tasks, including AI-powered insights and support, advanced integrations and plugins, and customizable dashboards and reports.
Integrability – 20%
We considered how well each tool integrated with other software and cloud solutions from the same vendor as well as how easy it is to set up third-party integrations either via prebuilt connectors or capable APIs. In particular, we examined how well each platform integrated with common data sources outside of its vendor ecosystem, including platforms like Redshift, Snowflake, Salesforce, and Dropbox.
Cost and accessibility – 20%
For cost and accessibility, we not only focused on low-cost solutions but also on how well each solution’s entry-level solutions perform and meet user needs. We assessed the user features available at each pricing tier, how quickly pricing rises — especially for individual user licenses or any required add-ons, and whether or not a comprehensive free version was available to help users get started.
Bottom Line: Looker vs. Power BI
Microsoft’s Power BI has consistently been among the top two and three business intelligence tools on the market, recruiting and retaining new users with its balance of easy-to-use features, low costs, useful dashboards and visualizations, range of data preparation and management tools, AI assistance, and Microsoft-specific integrations. It is both a great starter and advanced data platform solution, as it offers the features necessary for citizen data scientists and more experienced data analysts to get the most out of their datasets.
Power BI tends to be the preferred tool of the two because of its general accessibility and approachability as a tool, but there are certain enterprise user needs for reporting and analytics distribution where Looker far outperforms Power BI. And for those heavily leaning on Google platforms or third-party applications, Looker offers distinct advantages to skilled analysts.
Ultimately, Looker doesn’t really try to compete head-to-head with Microsoft, because they each target different data niches and scenarios. It’s often the case that prospective buyers will quickly be able to identify which of these tools is the best fit for their needs, but if you’re still not sure, consider reaching out to both vendors to schedule a hands-on demo.
Read next: Best Data Mining Tools and Software
